Data Collection and Recruitment
To collect responses for our survey, we used two main recruitment arenas targeting young people.
Recruitment Through High Schools
First, we reached out to upper secondary school teachers. We obtained their contact information through school websites, as well as by contacting our own former teachers. We asked them to distribute the survey to their students, which allowed us to reach a large number of respondents within our target group.
Open Day at the University of Stavanger
The second part of our data collection took place during the Open Day event at the University of Stavanger on March 3rd, 2026. This event is organized for high school seniors, where the university presents its study programs through stands and activities across campus. Student organizations also participate.
During the event, we set up two stands: one representing the political science program and one representing its student association. The data collection was carried out by our group of six researchers in collaboration with the student association Statsviterne UiS (The Political Science Student Association), who helped us staff the stands throughout the day.
Visual Identity and Credibility
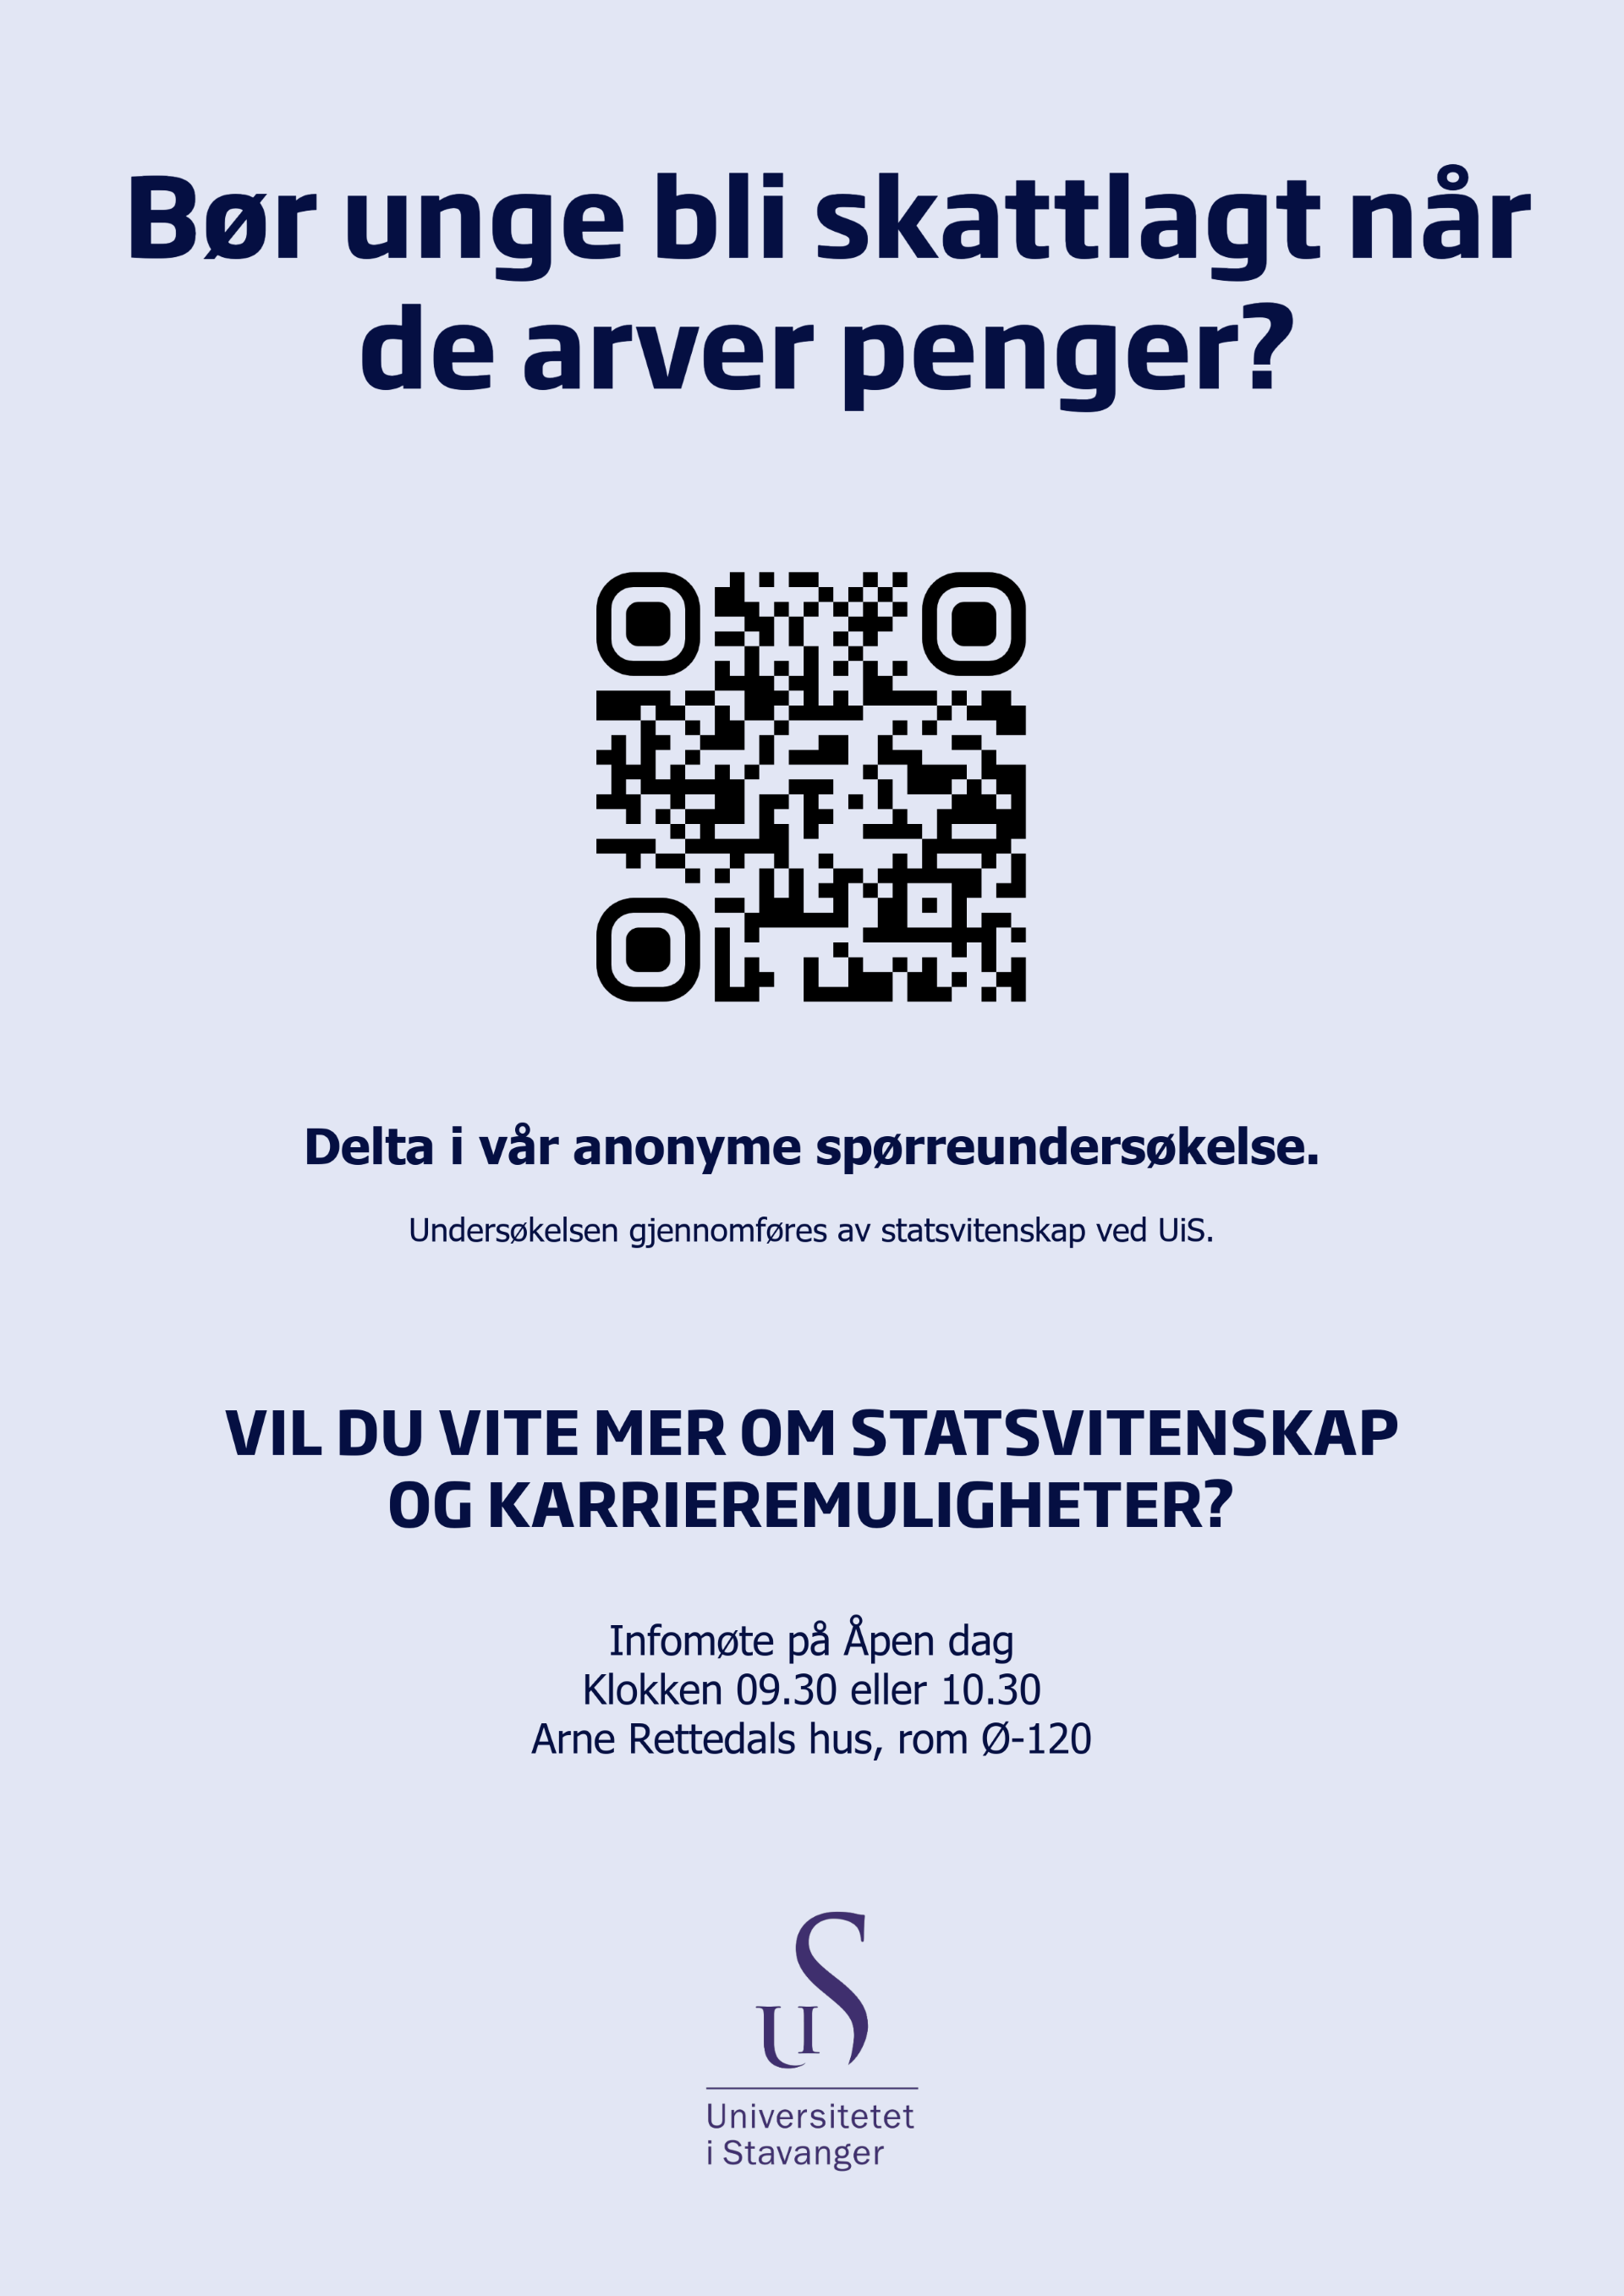
We actively engaged with visitors and handed out flyers containing a QR code linking directly to our survey. The flyers were designed in collaboration with the university to give the survey a more official appearance and strengthen its credibility. For the same reason, we wore t-shirts with the University of Stavanger logo, which contributed to presenting the project as more trustworthy and legitimate.
Field Strategies
To maximize participation, we used several practical strategies throughout the day. We positioned team members outside lecture halls where visiting students attended introductory presentations, allowing us to reach many students at once as they exited. In addition, we placed flyers in high-traffic areas such as the cafeteria, common areas, bulletin boards, and restroom doors.
At our stands, we also offered snacks and cake to attract attention and encourage interaction. These efforts helped us engage a large number of students and increased the likelihood that they would scan the QR code and complete the survey.
Sample Composition
While the survey was distributed to teachers across different regions of Norway, we acknowledge that the majority of respondents are from South-Western Norway, specifically the Rogaland area. This is primarily due to the extensive data collection carried out during the Open Day event at the University of Stavanger.